Published on November 3, 2024
Technical Analysis Basics: Chart Patterns Every Trader Should Know

Understanding chart patterns is fundamental to technical analysis and can significantly enhance your trading decisions. These visual formations on price charts represent the collective psychology of market participants and often signal potential future price movements. Whether you're a beginner or looking to refine your skills, mastering these essential patterns is crucial for success in active trading.
What Are Chart Patterns?
Chart patterns are recognizable formations created by the price movements of securities on a chart. These patterns emerge from the interaction of supply and demand forces in the market and tend to repeat over time. Traders use these patterns to identify potential trading opportunities by predicting where prices might move next based on historical behavior.
The reliability of chart patterns stems from market psychology. When enough traders recognize and act on the same pattern, it becomes a self-fulfilling prophecy. However, it's important to remember that no pattern guarantees a specific outcome, and proper risk management is always essential.
Reversal Patterns
Head and Shoulders
The head and shoulders pattern is one of the most reliable reversal patterns in technical analysis. It consists of three peaks: a higher peak (the head) between two lower peaks (the shoulders). This pattern typically forms at the end of an uptrend and signals a potential reversal to a downtrend.
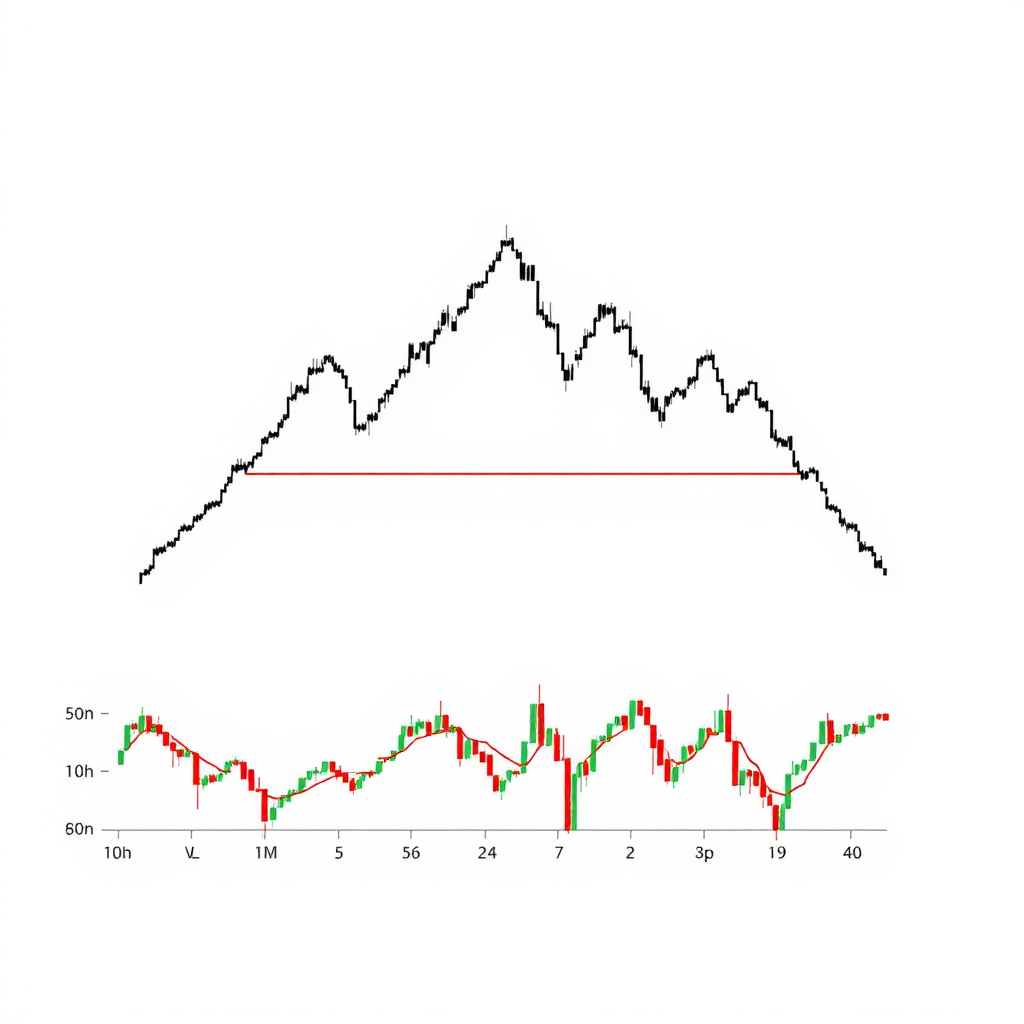
The pattern is confirmed when the price breaks below the neckline, which connects the lows between the peaks. The projected price target is typically calculated by measuring the distance from the head to the neckline and projecting that distance downward from the breakout point. Volume typically decreases as the pattern forms and increases on the breakout, adding confirmation to the signal.
The inverse head and shoulders pattern works in the opposite direction, forming at the bottom of a downtrend and signaling a potential reversal to an uptrend. The same principles apply, but the pattern is flipped upside down.
Double Top and Double Bottom
Double tops and double bottoms are classic reversal patterns that signal a change in trend direction. A double top forms after an uptrend when the price reaches a resistance level twice, failing to break through on the second attempt. This creates an "M" shape on the chart and suggests that buyers are losing momentum.
Conversely, a double bottom forms after a downtrend when the price tests a support level twice without breaking below it. This creates a "W" shape and indicates that sellers are exhausting their pressure. The pattern is confirmed when the price breaks through the middle peak (for double tops) or middle trough (for double bottoms) between the two formations.
Continuation Patterns
Triangles
Triangle patterns represent periods of consolidation before the price continues in its previous direction. There are three main types of triangles: ascending, descending, and symmetrical.
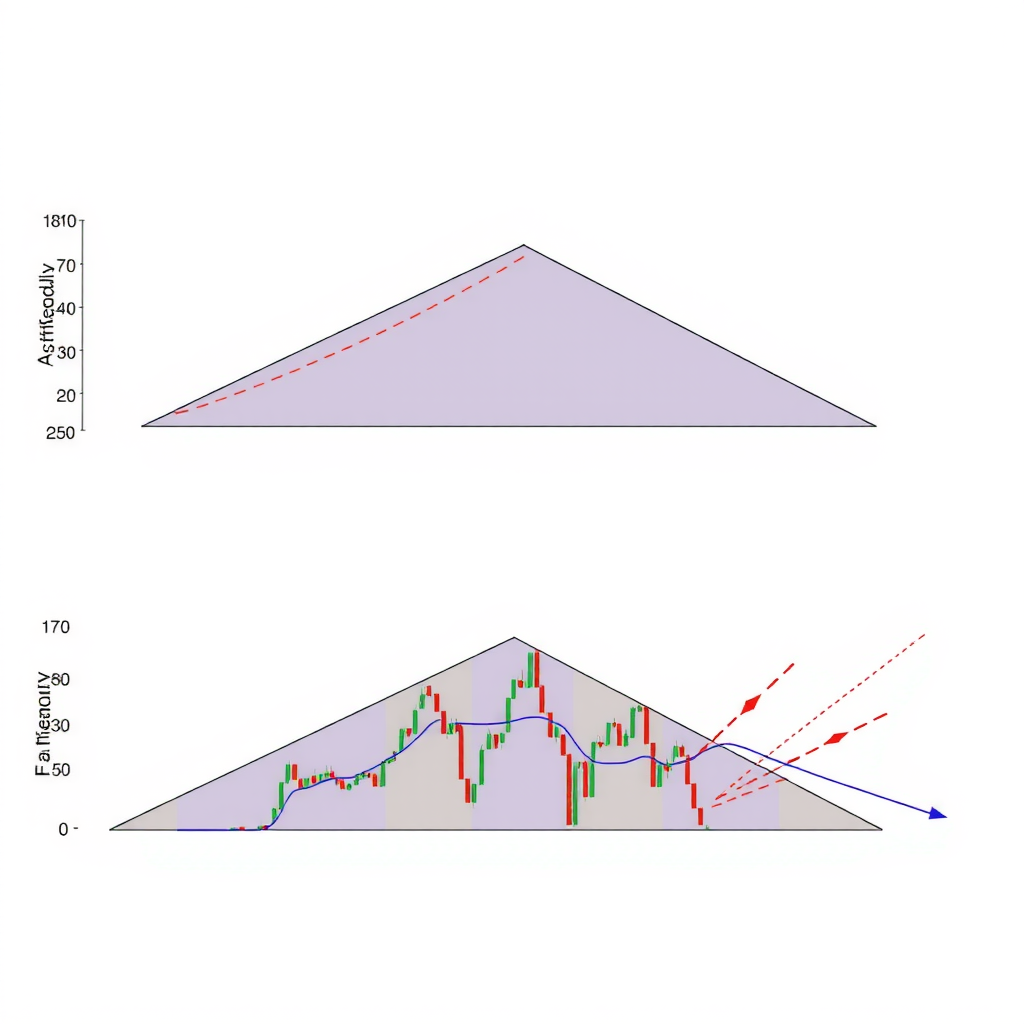
An ascending triangle forms when the price creates higher lows while repeatedly testing a horizontal resistance level. This pattern is generally bullish and suggests that buyers are becoming more aggressive. A descending triangle is the opposite, with lower highs testing a horizontal support level, typically indicating bearish sentiment.
Symmetrical triangles form when both the highs and lows converge toward a point, creating a triangle shape. This pattern indicates indecision in the market and can break out in either direction, though it typically continues the prior trend. The breakout direction and volume are crucial for confirming the pattern.
Flags and Pennants
Flags and pennants are short-term continuation patterns that form after a strong price movement. A flag appears as a rectangular consolidation that slopes against the prevailing trend, while a pennant looks like a small symmetrical triangle. Both patterns typically last between one and three weeks and signal a brief pause before the trend resumes.
These patterns are characterized by a sharp price movement (the flagpole) followed by a consolidation period (the flag or pennant). The breakout from the consolidation usually occurs in the same direction as the initial move, with the price target being approximately equal to the length of the flagpole projected from the breakout point.
Bilateral Patterns
Rectangles
Rectangle patterns, also known as trading ranges or consolidation zones, occur when the price moves sideways between parallel support and resistance levels. This pattern represents a period of equilibrium between buyers and sellers, with neither side able to gain control.
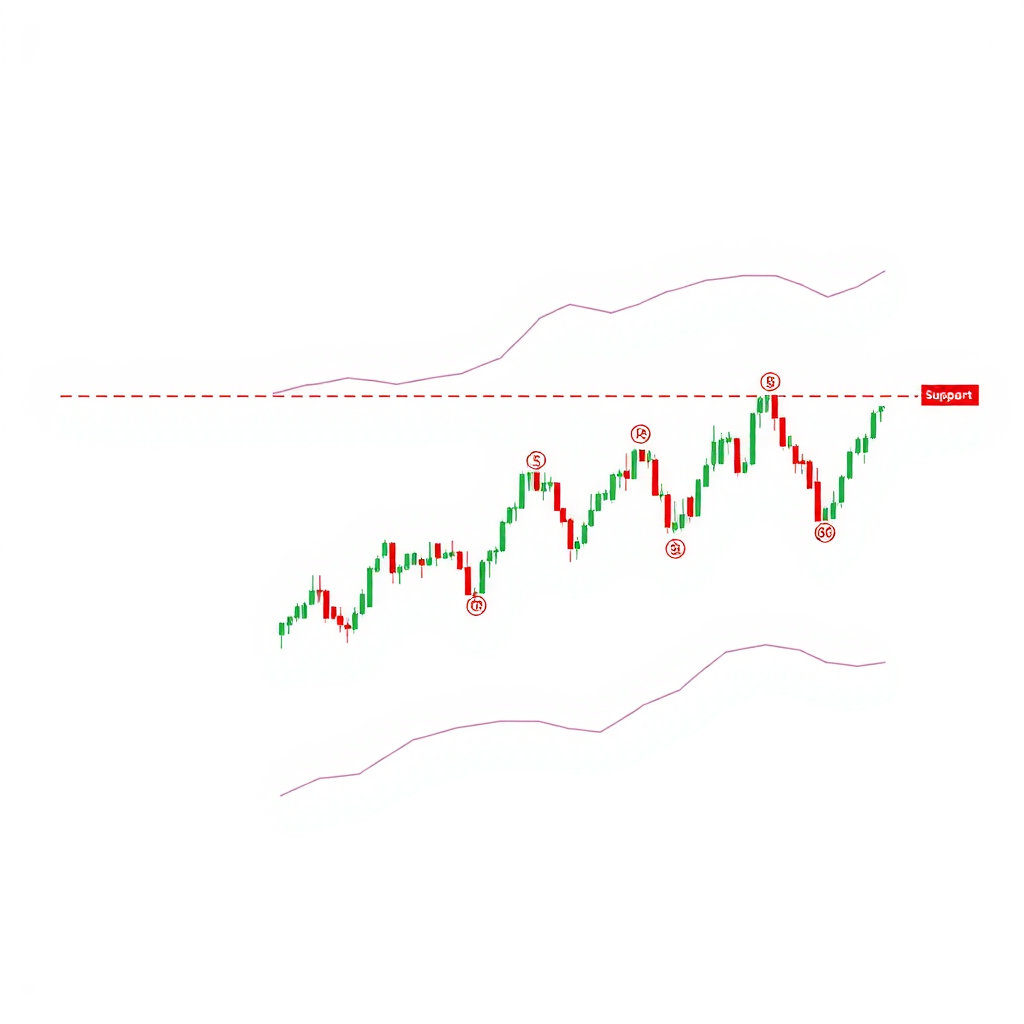
Rectangles can act as either continuation or reversal patterns, depending on the direction of the breakout. Traders often look for decreased volume during the consolidation phase and increased volume on the breakout to confirm the pattern. The price target is typically calculated by measuring the height of the rectangle and projecting it in the direction of the breakout.
Identifying Patterns in Real-Time
Successfully identifying chart patterns in real-time requires practice and patience. Here are key considerations for pattern recognition:
Time Frame Selection
Different time frames can reveal different patterns. While day traders might focus on 5-minute or 15-minute charts, swing traders typically analyze daily or weekly charts. The reliability of a pattern generally increases with the time frame, as longer-term patterns involve more market participants and data points.
Volume Confirmation
Volume plays a crucial role in validating chart patterns. Typically, volume should decrease during pattern formation and increase significantly on the breakout. This volume behavior confirms that the pattern has genuine market participation and is more likely to result in a sustained move.
Context Matters
Always consider the broader market context when analyzing patterns. A bullish pattern in a strong uptrend is more reliable than the same pattern in a downtrend. Similarly, patterns that align with major support or resistance levels, trend lines, or moving averages carry more weight.
Common Mistakes to Avoid
Even experienced traders can fall into traps when working with chart patterns. Being aware of these common mistakes can help you avoid costly errors:
Forcing Patterns:One of the most common mistakes is seeing patterns where they don't exist. Not every price movement forms a recognizable pattern, and trying to force a pattern onto a chart can lead to false signals. Be patient and wait for clear, well-defined formations.
Ignoring Failed Patterns:Not all patterns complete successfully. Sometimes the price breaks out in the expected direction but quickly reverses, creating a false breakout. Always use stop-loss orders to protect against failed patterns, and be prepared to exit if the pattern doesn't develop as anticipated.
Neglecting Risk Management:Even the most reliable patterns can fail. Never risk more than you can afford to lose on a single trade, regardless of how confident you are in a pattern. Use proper position sizing and always have a clear exit strategy before entering a trade.

Combining Patterns with Other Indicators
While chart patterns are powerful tools on their own, combining them with other technical indicators can significantly improve your trading accuracy. Moving averages can help confirm trend direction, while oscillators like RSI or MACD can identify overbought or oversold conditions that align with pattern formations.
Support and resistance levels are particularly important when analyzing chart patterns. Patterns that form near significant support or resistance levels tend to be more reliable, as these levels represent areas where many traders are watching and ready to act. Similarly, patterns that align with Fibonacci retracement levels or pivot points carry additional weight.
Candlestick patterns can also provide valuable confirmation. For example, a bullish engulfing pattern at the neckline of an inverse head and shoulders formation adds conviction to the reversal signal. Learning to recognize these complementary signals can help you make more informed trading decisions.
Practice and Patience
Mastering chart patterns requires dedicated practice and patience. Start by studying historical charts and identifying patterns after they've completed. This retrospective analysis helps train your eye to recognize the formations without the pressure of real-time trading. Many successful traders spend months or even years practicing pattern recognition before consistently profiting from it.
Consider keeping a trading journal where you document the patterns you identify, your entry and exit points, and the outcomes of your trades. This practice helps you learn from both successes and failures, gradually improving your pattern recognition skills and trading discipline.
Remember that chart patterns are just one tool in a trader's arsenal. They work best when combined with solid risk management, proper position sizing, and a clear trading plan. No pattern is foolproof, and even the most experienced traders experience losses. The key is to maintain consistency, learn from your mistakes, and continuously refine your approach.
Key Takeaways
- Chart patterns represent recurring formations that help predict future price movements
- Reversal patterns like head and shoulders signal potential trend changes
- Continuation patterns like triangles and flags indicate brief pauses before trend resumption
- Volume confirmation is crucial for validating pattern breakouts
- Always use proper risk management regardless of pattern reliability
- Combine patterns with other technical indicators for better accuracy
- Practice pattern recognition on historical charts before trading live
Understanding and applying chart patterns effectively takes time and experience, but the effort is worthwhile. These patterns provide a structured framework for analyzing price action and making informed trading decisions. As you develop your skills, you'll find that pattern recognition becomes more intuitive, allowing you to spot opportunities more quickly and trade with greater confidence.
Whether you're analyzing head and shoulders formations, triangle breakouts, or flag continuations, remember that successful trading is about probability, not certainty. Use chart patterns as part of a comprehensive trading strategy that includes proper risk management, emotional discipline, and continuous learning. With dedication and practice, these essential patterns can become valuable tools in your trading journey.