Market volatility represents one of the most fundamental concepts that every trader must understand. It measures the rate and magnitude of price movements in financial markets, serving as a critical indicator of market sentiment, risk levels, and potential trading opportunities. Whether you're analyzing stocks, commodities, or currency pairs, understanding volatility helps inform better trading decisions.
In this comprehensive guide, we'll explore the various dimensions of market volatility, from its basic definitions to advanced analytical techniques used by professional traders. By understanding these concepts, you'll be better equipped to navigate different market conditions and develop more robust trading strategies.
What is Market Volatility?
Market volatility refers to the degree of variation in trading prices over time. High volatility indicates large price swings, while low volatility suggests more stable, predictable price movements. Volatility itself is neither inherently good nor bad—it simply represents the market's current state and the level of uncertainty among participants.
Traders often measure volatility using statistical methods that quantify price dispersion around an average value. The most common measure isstandard deviation, which calculates how much prices deviate from their mean over a specific period. A higher standard deviation indicates greater volatility.
Key Insight:Volatility is not the same as risk, though the two concepts are related. While volatile markets can present higher risk, they also offer increased opportunities for traders who understand how to analyze and respond to price movements effectively.
Types of Volatility
Understanding the different types of volatility helps traders select appropriate analytical tools and develop suitable strategies for various market conditions.
Historical Volatility
Historical volatility, also known as realized volatility, measures actual price movements that have already occurred. Traders calculate this by analyzing past price data over specific timeframes—commonly 10, 20, 30, or 90 days. This backward-looking measure provides context for current market conditions by showing how volatile prices have been in the recent past.
Historical volatility calculations typically use closing prices, though some traders prefer using high-low ranges for a more comprehensive view of intraday price action. The resulting percentage indicates the annualized standard deviation of returns, allowing for comparison across different assets and timeframes.
Implied Volatility
Implied volatility represents the market's expectation of future price movements, derived from options pricing. Unlike historical volatility, which looks backward, implied volatility is forward-looking and reflects collective market sentiment about upcoming price action.
Options traders pay particular attention to implied volatility because it directly affects options premiums. Higher implied volatility increases option prices, as greater expected price movement makes options more valuable. Traders often compare implied volatility to historical volatility to identify potential trading opportunities.
Intraday Volatility
Intraday volatility measures price fluctuations within a single trading session. Day traders and scalpers focus heavily on this type of volatility, as it directly impacts their short-term trading strategies. Intraday volatility often follows predictable patterns, with increased activity typically occurring at market open and close.
Key Volatility Indicators
Professional traders use various technical indicators to measure and analyze volatility. Each indicator offers unique insights into market dynamics and price behavior.
Essential Volatility Indicators
- Average True Range (ATR):Measures the average range between high and low prices over a specified period, providing a clear picture of typical price movement magnitude
- Bollinger Bands:Uses standard deviation bands around a moving average to visualize volatility expansion and contraction
- VIX (Volatility Index):Often called the "fear gauge," this index measures expected volatility in the S&P 500 based on options pricing
- Standard Deviation:Calculates the dispersion of prices from their average, offering a statistical measure of volatility
- Keltner Channels:Similar to Bollinger Bands but uses ATR instead of standard deviation, providing an alternative volatility visualization
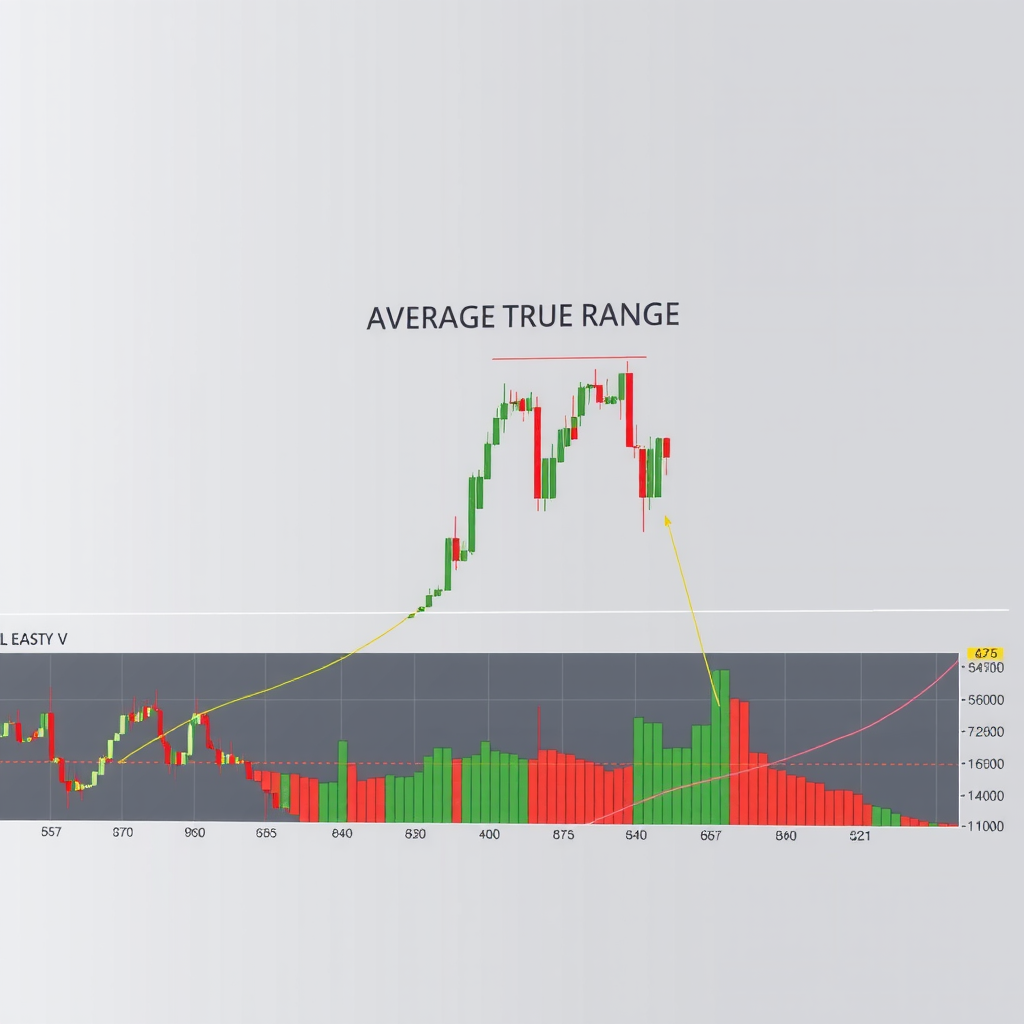
Average True Range (ATR)
The Average True Range stands as one of the most reliable volatility indicators. Developed by J. Welles Wilder Jr., ATR measures market volatility by calculating the average of true ranges over a specified period, typically 14 days. The true range represents the greatest of three values: current high minus current low, absolute value of current high minus previous close, or absolute value of current low minus previous close.
Traders use ATR for multiple purposes: setting stop-loss levels, determining position sizes, and identifying potential breakout opportunities. A rising ATR suggests increasing volatility, while a declining ATR indicates decreasing volatility. Unlike many indicators, ATR doesn't predict price direction—it simply measures the degree of price movement.
Bollinger Bands
Bollinger Bands consist of three lines: a simple moving average (typically 20 periods) in the middle, with upper and lower bands set at two standard deviations above and below the moving average. These bands expand during volatile periods and contract during quieter market conditions, providing visual representation of volatility changes.
Traders observe several key patterns with Bollinger Bands. When prices touch or exceed the upper band, it may indicate overbought conditions, while touches of the lower band might suggest oversold conditions. However, during strong trends, prices can "walk the band," staying near the upper or lower boundary for extended periods. The width of the bands themselves serves as a volatility indicator—narrow bands suggest low volatility that may precede significant price movements.
Factors Influencing Market Volatility
Understanding what drives volatility helps traders anticipate potential market changes and adjust their strategies accordingly. Multiple factors contribute to volatility levels across different markets and timeframes.
Economic Data Releases
Scheduled economic announcements often trigger significant volatility spikes. Key reports include employment data, inflation figures, GDP growth rates, and central bank policy decisions. Traders typically see increased volatility in the hours surrounding these releases as market participants react to new information and adjust their positions.
The impact of economic data varies depending on market expectations. When actual figures significantly differ from consensus forecasts, volatility tends to increase more dramatically. Experienced traders often reduce position sizes or avoid trading entirely around major announcements to manage risk during these uncertain periods.
Market Sentiment and News Events
Unexpected news events—geopolitical developments, corporate earnings surprises, or sudden policy changes—can cause rapid volatility increases. Market sentiment shifts quickly in response to breaking news, leading to sharp price movements as traders reassess their positions.
Social media and 24-hour news cycles have accelerated information dissemination, potentially increasing market reactivity to news events. Traders must stay informed about current events while maintaining disciplined risk management practices to navigate news-driven volatility effectively.
| Market Condition | Typical Volatility Level | Trading Considerations |
|---|---|---|
| Bull Market Trending | Low to Moderate | Steady trends with occasional pullbacks; trend-following strategies often effective |
| Bear Market Declining | High | Sharp downward movements with volatile rebounds; increased risk management crucial |
| Range-Bound Market | Low | Prices oscillate within defined boundaries; mean-reversion strategies may work well |
| Breakout Period | Increasing | Volatility expands as prices exit consolidation; momentum strategies gain relevance |
| Crisis/Panic Selling | Extremely High | Rapid price declines with high uncertainty; preservation of capital becomes priority |
Market Liquidity
Liquidity levels significantly affect volatility. Highly liquid markets with many active participants typically experience smoother price movements, while illiquid markets can see exaggerated price swings from relatively small orders. Trading volume serves as a key indicator of liquidity—higher volume generally corresponds to better liquidity and potentially lower volatility.
Time of day also impacts liquidity and volatility. Major market sessions (London, New York, Tokyo) see increased trading activity and liquidity. Overlap periods between sessions often produce the highest liquidity, while off-hours trading may experience reduced liquidity and increased volatility from smaller order flows.
Analyzing Volatility Patterns
Successful traders develop skills in recognizing volatility patterns and understanding their implications for market behavior. These patterns often repeat across different markets and timeframes, providing valuable context for trading decisions.
Volatility Cycles
Markets tend to move through cycles of high and low volatility. Periods of low volatility, characterized by narrow price ranges and compressed technical indicators, often precede significant price movements. This phenomenon occurs because low volatility periods represent market equilibrium—a temporary balance between buyers and sellers that eventually breaks down.
Conversely, high volatility periods eventually give way to calmer market conditions as uncertainty resolves and new equilibrium levels establish. Recognizing these cycles helps traders anticipate potential market transitions and adjust their strategies accordingly.
Volatility Clustering
Volatility clustering refers to the tendency for high volatility periods to follow other high volatility periods, and low volatility to follow low volatility. This pattern reflects how market uncertainty and trader behavior create momentum in volatility itself. Understanding this clustering helps traders set appropriate expectations for near-term market conditions.
During clustered high volatility, traders might widen stop-loss levels, reduce position sizes, or focus on shorter timeframes. In low volatility clusters, traders might tighten stops, increase position sizes moderately, or look for range-bound trading opportunities.
Practical Applications for Traders
Understanding volatility theory matters little without practical application. Here's how traders incorporate volatility analysis into their daily decision-making processes.
Position Sizing Based on Volatility
Volatility-based position sizing helps traders maintain consistent risk levels across different market conditions. When volatility increases, traders reduce position sizes to maintain the same dollar risk per trade. Conversely, during low volatility periods, position sizes can increase while maintaining appropriate risk parameters.
The ATR indicator proves particularly useful for this purpose. Traders calculate position size by dividing their maximum acceptable loss by the current ATR value, ensuring that position size adjusts automatically to current market conditions. This approach helps prevent overleveraging during volatile periods while maximizing opportunity during stable conditions.
Stop-Loss Placement
Volatility analysis significantly improves stop-loss placement. Setting stops too tight in volatile markets leads to premature exits from potentially profitable trades, while stops set too wide in calm markets expose traders to unnecessary risk. Using volatility-based stops—such as placing stops at 2x or 3x ATR from entry—creates dynamic risk management that adapts to current market conditions.
Professional Tip:Many experienced traders use a combination of technical levels and volatility-based stops. They place stops beyond key support or resistance levels, but also ensure the stop distance aligns with current volatility measurements to avoid both premature exits and excessive risk exposure.
Strategy Selection
Different trading strategies perform better in different volatility environments. Trend-following strategies typically excel during moderate volatility with clear directional movement, while mean-reversion strategies often work better in low volatility, range-bound conditions. Breakout strategies may perform well during volatility expansion phases.
Successful traders maintain multiple strategies in their toolkit and select approaches based on current volatility conditions. This flexibility allows them to adapt to changing market dynamics rather than forcing a single strategy across all conditions.
Common Volatility Trading Mistakes
Even experienced traders sometimes fall into common traps when dealing with market volatility. Awareness of these pitfalls helps avoid costly errors.
Ignoring Volatility Changes
Some traders use fixed stop-loss distances or position sizes regardless of current volatility levels. This approach leads to inconsistent risk management—taking excessive risk during volatile periods while being overly conservative during calm markets. Always adjust risk parameters based on current volatility measurements.
Overtrading During High Volatility
High volatility can create the illusion of abundant opportunities, tempting traders to increase trading frequency. However, volatile markets also increase execution challenges, slippage, and emotional stress. Maintain discipline and avoid overtrading simply because markets are moving more than usual.
Misinterpreting Volatility Indicators
Volatility indicators measure price movement magnitude, not direction. A common mistake involves treating high volatility readings as directional signals. Remember that volatility can increase during both uptrends and downtrends—the indicator itself doesn't predict which direction prices will move.
Advanced Volatility Concepts
As traders gain experience, they can explore more sophisticated volatility concepts that provide additional analytical depth.
Volatility Skew
In options markets, volatility skew refers to the pattern where implied volatility differs across strike prices. Typically, out-of-the-money put options show higher implied volatility than calls, reflecting market participants' tendency to pay more for downside protection. Understanding skew helps options traders identify potentially mispriced contracts and assess market sentiment.
Correlation and Volatility
Asset correlations often change during high volatility periods. Diversification strategies that work well during calm markets may prove less effective during crises when correlations increase and assets move together. Monitoring correlation changes alongside volatility helps traders maintain effective portfolio diversification.
Conclusion
Market volatility represents a fundamental aspect of trading that demands thorough understanding and continuous attention. By mastering volatility analysis, traders gain crucial insights into market dynamics, improve risk management practices, and make more informed trading decisions across various market conditions.
Remember that volatility itself is neither friend nor enemy—it's simply a characteristic of markets that creates both opportunities and challenges. Successful traders respect volatility, adapt their strategies to current conditions, and maintain disciplined risk management regardless of market behavior.
Continue developing your volatility analysis skills through regular market observation, indicator study, and careful review of how different volatility levels affect your trading results. This ongoing education will serve you well throughout your trading career, helping you navigate the ever-changing landscape of financial markets with greater confidence and competence.
Key Takeaways
- Volatility measures the magnitude of price movements, not their direction
- Different types of volatility (historical, implied, intraday) serve different analytical purposes
- Technical indicators like ATR and Bollinger Bands help quantify and visualize volatility
- Economic events, market sentiment, and liquidity levels all influence volatility
- Volatility cycles and clustering create recognizable patterns that inform trading decisions
- Position sizing, stop-loss placement, and strategy selection should all adapt to current volatility
- Avoid common mistakes like ignoring volatility changes or overtrading during volatile periods
- Advanced concepts like volatility skew and correlation changes provide additional analytical depth