Technical Analysis Basics for Crypto Trading
Master the fundamentals of reading cryptocurrency charts, identifying key patterns, and using technical indicators to make informed trading decisions in the dynamic crypto market.
Understanding Cryptocurrency Charts
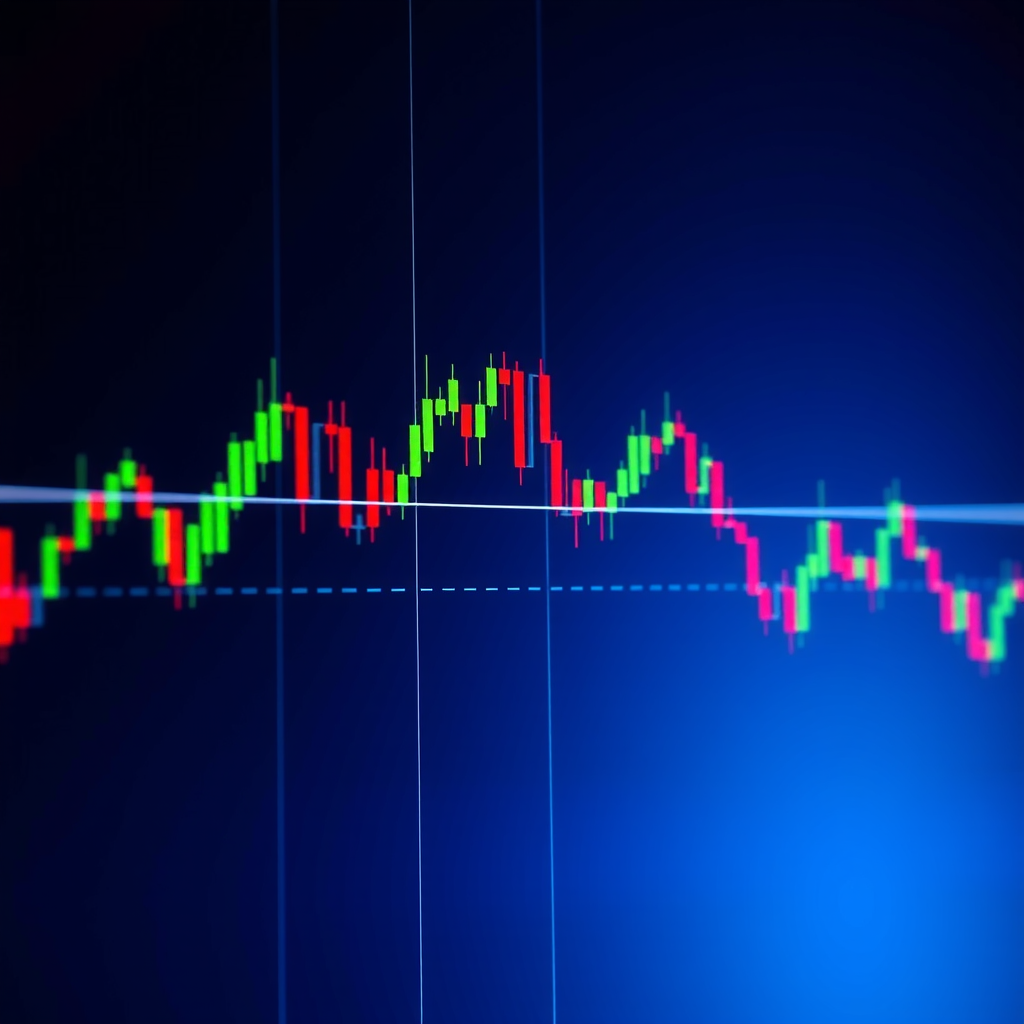
Technical analysis begins with understanding how to read cryptocurrency charts. Unlike traditional markets, crypto markets operate 24/7, creating unique patterns and opportunities. The most common chart type used by traders is the candlestick chart, which provides comprehensive information about price action within specific time frames.
Each candlestick represents a specific time period and displays four critical price points: the opening price, closing price, highest price, and lowest price during that period. The body of the candlestick shows the range between opening and closing prices, while the wicks (or shadows) extend to show the highest and lowest prices reached.
Chart Timeframes
Different timeframes serve different trading styles. Day traders typically use 5-minute to 1-hour charts, swing traders focus on 4-hour to daily charts, while long-term investors analyze daily to weekly charts. Understanding multiple timeframes provides better context for trading decisions.
Support and Resistance Levels
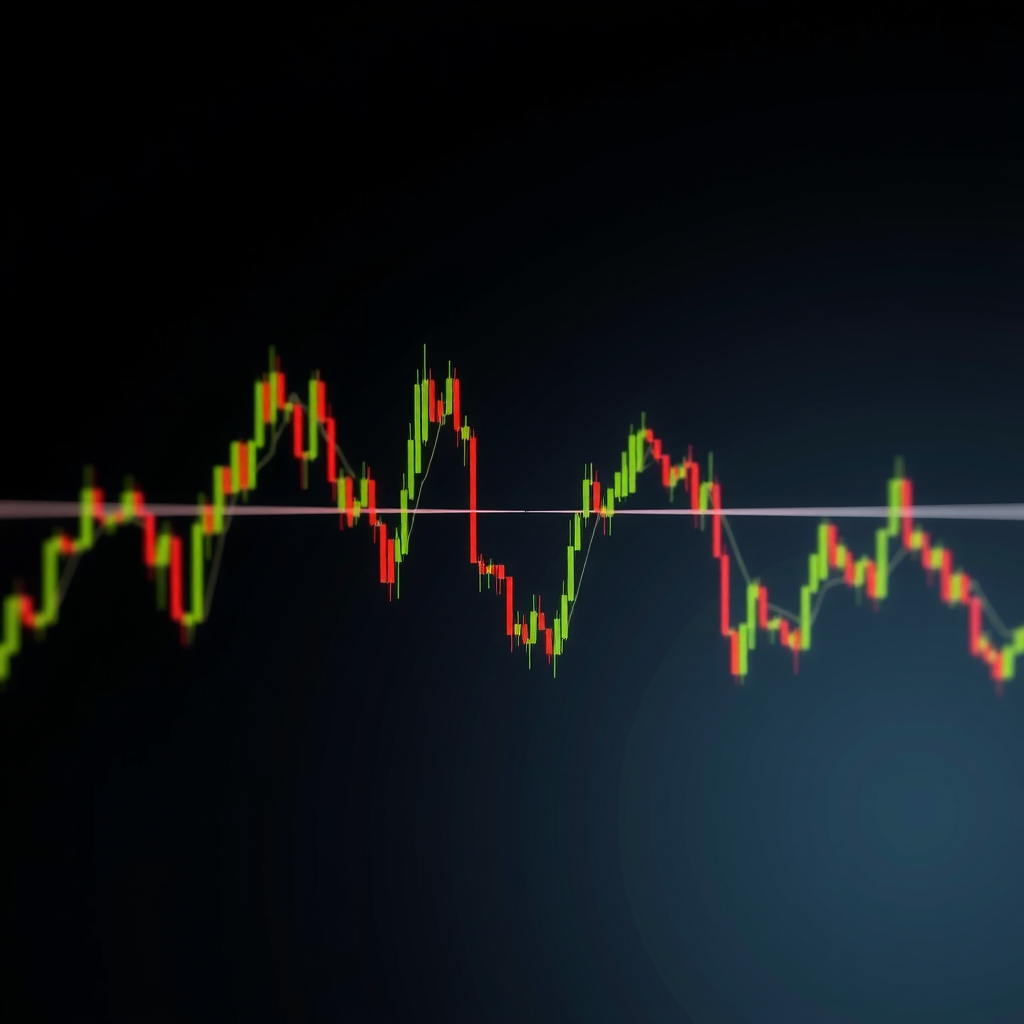
Support and resistance levels are fundamental concepts in technical analysis. Support represents a price level where buying pressure is strong enough to prevent the price from falling further, while resistance is a level where selling pressure prevents the price from rising higher. These levels are formed by historical price action and represent psychological barriers in the market.
Support Levels
Price floors where demand increases. When price approaches support, buyers typically enter the market, creating upward pressure. Breaking below support often signals further downside potential.
Resistance Levels
Price ceilings where supply increases. As price approaches resistance, sellers enter the market, creating downward pressure. Breaking above resistance often indicates bullish momentum.
Identifying these levels requires analyzing historical price data and looking for areas where price has repeatedly reversed direction. The more times a level has been tested without breaking, the stronger it becomes. When a support level is broken, it often becomes a new resistance level, and vice versa—a concept known as role reversal.
Candlestick Patterns
Candlestick patterns provide valuable insights into market sentiment and potential price movements. These patterns, developed centuries ago in Japanese rice trading, remain highly relevant in modern cryptocurrency markets. Understanding these formations helps traders anticipate potential reversals or continuations in price trends.
Doji
Indicates market indecision with equal open and close prices
Hammer
Bullish reversal pattern with long lower wick
Shooting Star
Bearish reversal pattern with long upper wick
Multi-candlestick patterns like engulfing patterns, morning stars, and evening stars provide even stronger signals. An engulfing pattern occurs when a candle completely engulfs the previous candle's body, suggesting a potential trend reversal. These patterns are most reliable when they appear at key support or resistance levels and are confirmed by subsequent price action.
Moving Averages
Moving averages are among the most widely used technical indicators in cryptocurrency trading. They smooth out price data by creating a constantly updated average price over a specific time period, helping traders identify trends and potential entry or exit points. The two most common types are Simple Moving Averages (SMA) and Exponential Moving Averages (EMA).
The Simple Moving Average calculates the arithmetic mean of prices over a set period, giving equal weight to all data points. The Exponential Moving Average gives more weight to recent prices, making it more responsive to new information. Traders often use multiple moving averages together, such as the 50-day and 200-day moving averages, to identify trend changes.
When a shorter-term moving average crosses above a longer-term moving average, it creates a "golden cross," typically considered a bullish signal. Conversely, when the shorter-term average crosses below the longer-term average, it forms a "death cross," often interpreted as a bearish signal. However, these signals should always be confirmed with other indicators and analysis methods.
Relative Strength Index (RSI)
The Relative Strength Index is a momentum oscillator that measures the speed and magnitude of price changes. RSI values range from 0 to 100, with readings above 70 typically indicating overbought conditions and readings below 30 suggesting oversold conditions. This indicator helps traders identify potential reversal points and assess the strength of a trend.
RSI Interpretation Guide
While overbought and oversold levels provide useful signals, they should not be used in isolation. In strong trending markets, RSI can remain in overbought or oversold territory for extended periods. Divergence between RSI and price action often provides more reliable signals—when price makes new highs but RSI fails to do so, it suggests weakening momentum and potential reversal.
MACD (Moving Average Convergence Divergence)
The MACD is a trend-following momentum indicator that shows the relationship between two moving averages of an asset's price. It consists of three components: the MACD line (difference between 12-period and 26-period EMAs), the signal line (9-period EMA of the MACD line), and the histogram (difference between MACD and signal lines).
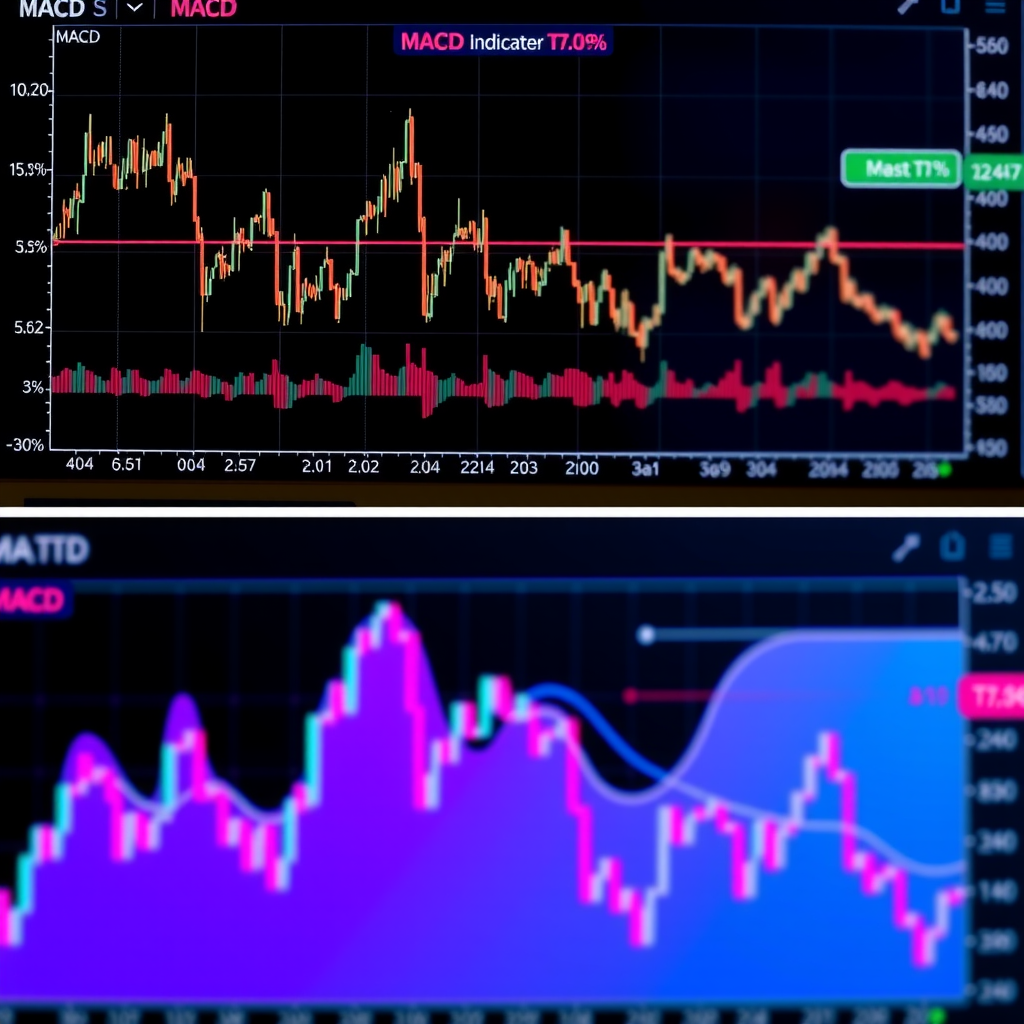
MACD generates signals through crossovers and divergences. When the MACD line crosses above the signal line, it produces a bullish signal, suggesting potential upward momentum. When it crosses below, it generates a bearish signal. The histogram visually represents the distance between these lines, with expanding bars indicating strengthening momentum and contracting bars suggesting weakening momentum.
Divergence between MACD and price action provides powerful signals. Bullish divergence occurs when price makes lower lows while MACD makes higher lows, suggesting weakening downward momentum. Bearish divergence happens when price makes higher highs while MACD makes lower highs, indicating potential trend exhaustion.
Chart Patterns and Formations
Chart patterns are formations created by price movements that tend to repeat over time, providing traders with visual cues about potential future price direction. These patterns fall into two main categories: continuation patterns, which suggest the current trend will continue, and reversal patterns, which indicate a potential trend change.
Triangles
Ascending, descending, and symmetrical triangles form when price consolidates between converging trendlines. These patterns typically resolve in the direction of the prevailing trend, with breakouts offering clear entry points.
Descending:Bearish continuation
Symmetrical:Neutral, follows trend
Head and Shoulders
A powerful reversal pattern consisting of three peaks, with the middle peak (head) being highest and two lower peaks (shoulders) on either side. The neckline connects the lows between peaks and serves as the breakout level.
Inverse:Bullish reversal at bottoms
Target:Height of head from neckline
Flags and Pennants
Short-term continuation patterns that form after strong price movements. Flags are rectangular consolidations, while pennants are small symmetrical triangles. Both typically resolve in the direction of the prior trend.
Volume:Decreases during formation
Breakout:Strong volume confirmation
Cup and Handle
A bullish continuation pattern resembling a teacup. The cup forms a rounded bottom, followed by a smaller consolidation (handle). Breakout above the handle's resistance often leads to significant upward movement.
Handle:Shallow pullback
Target:Cup depth added to breakout
Developing a Systematic Approach
Successful technical analysis requires a systematic approach that combines multiple tools and indicators. Rather than relying on a single indicator or pattern, experienced traders use confluence—the alignment of multiple signals pointing in the same direction. This multi-layered approach significantly improves the reliability of trading decisions.
Five-Step Analysis Framework
Identify the Trend
Begin by determining the overall market direction using multiple timeframes. Analyze daily and weekly charts to understand the broader trend, then zoom into shorter timeframes for entry timing.
Mark Key Levels
Identify and mark significant support and resistance levels, previous highs and lows, and psychological price levels. These serve as potential entry, exit, and stop-loss points.
Apply Indicators
Use a combination of trend-following indicators (moving averages, MACD) and momentum oscillators (RSI, Stochastic) to confirm your analysis and identify potential entry points.
Look for Patterns
Scan for recognizable chart patterns and candlestick formations that align with your trend analysis and indicator signals. Patterns provide context and potential price targets.
Confirm with Volume
Always verify your analysis with volume data. Strong moves should be accompanied by increasing volume, while consolidations typically show decreasing volume. Volume confirms the validity of breakouts and reversals.
Risk management is an integral part of any systematic approach. Always determine your position size, entry point, stop-loss level, and profit target before entering a trade. The risk-reward ratio should favor potential gains, typically aiming for at least a 2:1 or 3:1 ratio. Never risk more than a small percentage of your trading capital on a single trade.
Important Considerations
Technical analysis is not infallible and should be combined with fundamental analysis and market sentiment evaluation. Cryptocurrency markets are particularly volatile and can be influenced by news events, regulatory changes, and market manipulation. Always maintain proper risk management and never invest more than you can afford to lose.
Practical Application and Continuous Learning
Mastering technical analysis requires consistent practice and continuous learning. Start by paper trading or using small positions to test your analysis without significant financial risk. Keep a detailed trading journal documenting your analysis, entry and exit points, and the reasoning behind each trade. Review your trades regularly to identify patterns in your decision-making and areas for improvement.
The cryptocurrency market evolves rapidly, and successful traders adapt their strategies accordingly. Stay updated with market developments, study different trading styles, and be willing to adjust your approach based on changing market conditions. Remember that even experienced traders face losses—the key is maintaining discipline, following your systematic approach, and learning from both successful and unsuccessful trades.
Key Takeaways
- Technical analysis provides a framework for understanding price movements and making informed trading decisions
- Support and resistance levels, candlestick patterns, and chart formations offer valuable insights into market psychology
- Indicators like moving averages, RSI, and MACD help confirm trends and identify potential entry and exit points
- A systematic approach combining multiple analysis tools improves decision-making reliability
- Proper risk management and continuous learning are essential for long-term trading success
- Practice and patience are crucial—mastery comes through consistent application and experience
Technical analysis is a powerful tool in the cryptocurrency trader's arsenal, but it works best when combined with sound risk management, emotional discipline, and a commitment to continuous improvement. By understanding and applying these fundamental concepts, you can develop the analytical skills necessary to navigate the dynamic world of cryptocurrency trading with greater confidence and precision.